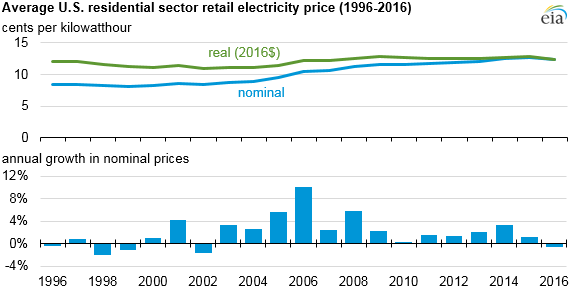
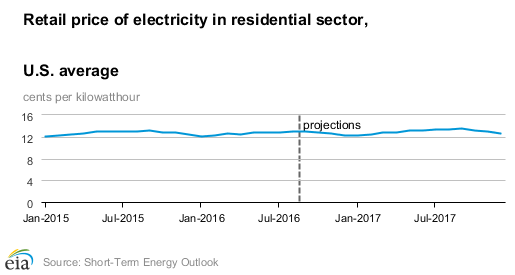
Countering a slow but sustained climb, data released this week by the U.S. Energy Information Administration shows that residential electricity prices for the first half of 2016 fell 0.7%, to a national average of 12.4 cents per kWh. Over the past five years, nominal residential prices have increased an average of 1.9% annually, about the same rate as overall inflation.
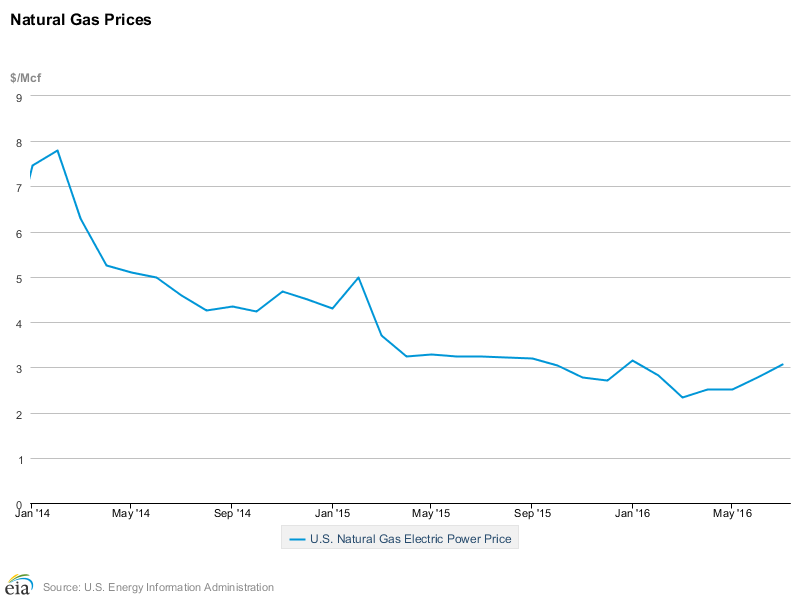
The key factor driving prices down this year is the low price of natural gas, the fuel that many power plants burn to produce electricity. Over the first six months of 2016, the weighted average cost of natural gas delivered to electricity generators was $2.58 per million Btu, 28% lower than in the first half of 2015 and down substantially from 2014.
Some regions are experiencing larger drops than others, though this is at least partly a reflection of prices being particularly high in those areas prior to this year’s decline:
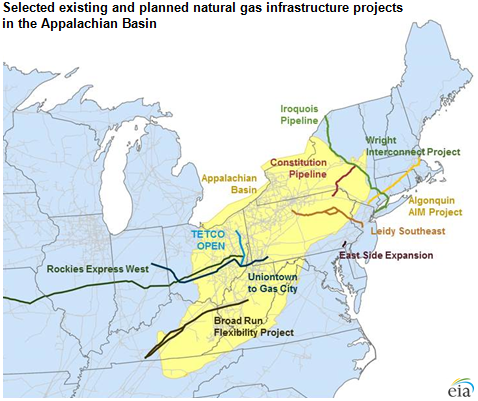
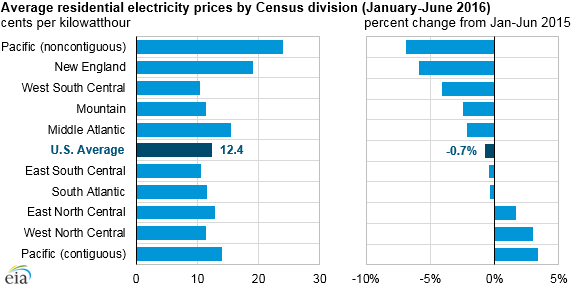 In New England, for example, where energy prices increased substantially from 2013 to 2014, prices in June of 2016 were 6% lower than in January of 2016. Prices in New England today are lower due to a sustained low price of natural gas nationally, combined with increased gas deliverability to a region that previously was constrained. Key pipeline projects that came online to serve that part of the country in late 2015 or early 2016 include:
- The Rockies Express Pipline (REX) reversal project had added westbound capacity to flow natural gas to the Midwest in 2014. In late 2015, Texas Eastern Transmission Company’s (Tetco) OPEN project added 550 million cubic feet per day (MMcf/d) of pipeline takeaway capacity out of Ohio.
- Columbia Gas Pipeline’s East Side Expansion, a 310 MMcf/d project that flows natural gas produced in Pennsylvania to Mid-Atlantic markets.
- Tennessee Gas Pipeline’s Broad Run Flexibility Project, a 590 MMcf/d project originating in West Virginia that moves natural gas to the Gulf Coast states.
- Tetco’s Uniontown-to-Gas City project flows up to 425 MMcf/d of natural gas produced in the Marcellus region to Indiana.
- Williams Transcontinental Pipeline’s Leidy Southeast project provides additional capacity to take Marcellus natural gas to Transco’s mainline, which extends from Texas to New York. From there, the natural gas serves Mid-Atlantic market areas as well as the Gulf Coast.
Notwithstanding the increase in pipeline capacity, the Energy Information Administration projects the national average delivered cost of natural gas in the last six months of 2016 will be 27% higher than the average cost in the first six months of the year. Residential electricity prices, in turn, are expected to increase by about 3% in 2017.
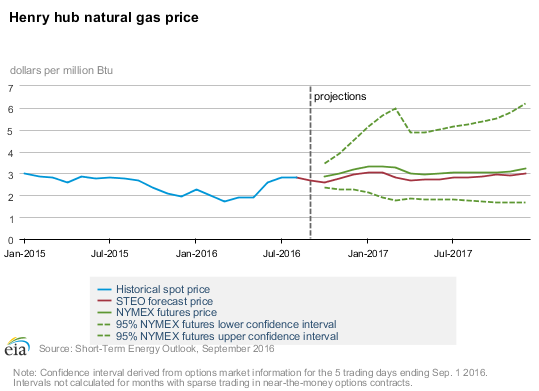
The 2017 projection is supported by the following graph, which shows current options and futures prices placing the lower and upper bounds for the 95% confidence interval for December 2016 contracts at $2.25/MMBtu and $4.51/MMBtu, respectively. According to the Energy Information Administration, the 2017 forecast Henry Hub average is $2.87/MMBtu (compared to $2.58/MMBtu for the first half of 2016).
Another factor causing retail prices (as opposed to wholesale prices) to rise is the increased costs utilities are passing on to customers to maintain, update, and secure their grids. Can anything be done to avoid or mitigate these price increases? One approach would be to reduce demand for electricity through energy efficiency, demand response, and behind-the-meter generation such as solar power. All else being equal, these practices should cause the price to fall due to a lower quantity of electricity demanded. Paradoxically, however, reduced demand for grid power could actually increase the price for those remaining on the grid because of a smaller pool of kWh over which the utility can spread fixed costs. Regulators in regulated and vertically-integrated states are taking a variety of approaches to this dilemma, as demonstrated by proceedings in states including (but not limited to) Nevada, New York, California, Massachusetts, Maryland, and Minnesota.
I invite you to view my other posts and sign up to receive future posts via email. I also invite you to follow me on LinkedIn and Twitter, and to contact me via my homepage.